Spreadsheet Homework Assignment
|
Due Date: |
Tuesday June 27 |
| Naming Assignment: |
Do your spreadsheet using
ScarletApps. Use the ScarletDocs component. (Google Sheets.) Name it exactly as
follows: HW6 Lastname,
Firstname (of course, use your name) - and also place it
in your CS110 Summer 2017 folder.
|
|
Printouts to |
|
|
Evaluation: |
15 points |
|
Related Materials: |
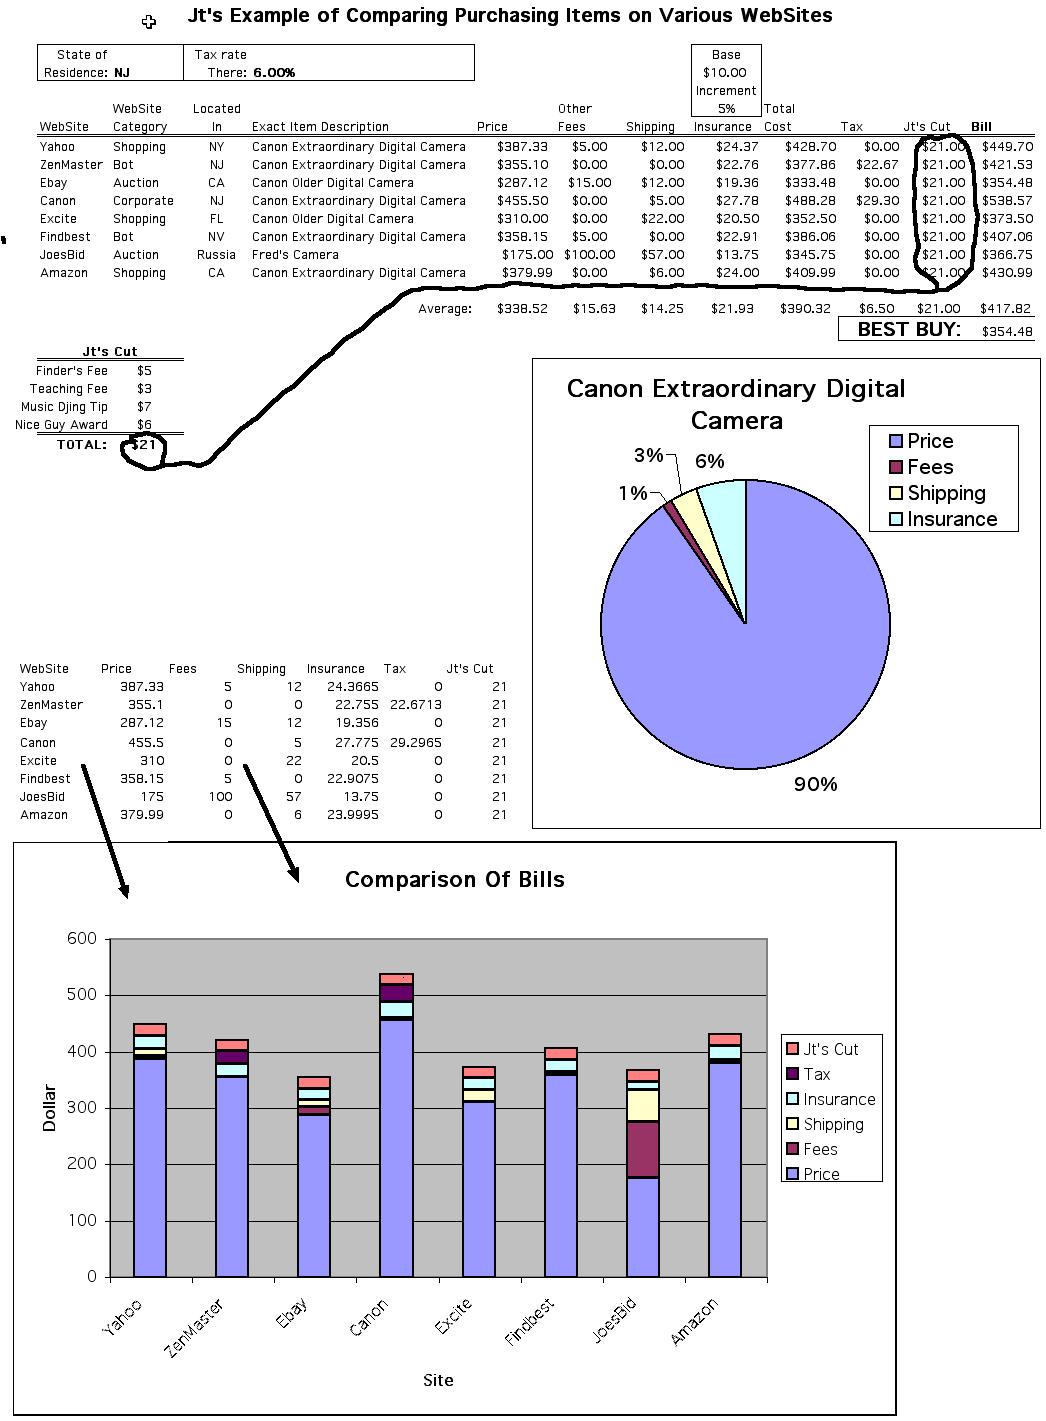
The example spreadsheet at the end of this webpage - best viewed online, rather than through a printout. The special webpage on the IF function. |
If you print this assignment, the example at the bottom will not print out nicely - as I have enlarged it to make it easier to follow. Therefore, when referring to it, it is best to view the example directly by visiting this website with a web-browser. (Safari, Firefox, Internet Explorer, Chrome etc.)
Preparation:
For this assignment, you will use the spreadsheet component of ScarletDocs. (Google Sheets.) One of the purposes of this assignment is to get you comfortable with using help features to look up the details on how to do different tasks. Make sure all your HW Theme product information is available before you set out to do this assignment. It would be extremely wise to experiment with the features in ScarletDocs spreadsheet component before attempting to do the actual assignment. You may also want to review how to use the IF function by looking at the more in-depth explanation I have provided on this linked webpage. If you do not want to struggle on this assignment, it is strongly suggested that you first carefully explore all of the following activities - by experimenting and using the Help features inside ScarletApps and google.
The Assignment:
Do your spreadsheet using ScarletApps. Use the ScarletDocs
component. Use Google Sheets as the document type. Name it exactly as follows: HW6 Lastname, Firstname
(of course, use your name) - and also place it in your CS110 Summer 2017 folder.
(Some of you still have not made your folder yet even though you
were supposed to do so during HW2. In other words, you
did not place that assignment in the folder. Fix that now or you
will continue to lose points on future assignments.)
This purpose of this assignment is to compare the price you would have to pay to purchase your product from different websites. Often other costs are involved in purchasing a product - shipping, insurance, taxes, etc. We will use the values of all these costs to compare the pricing you got through various websites. Just to make things more interesting, we will also include some made up costs.
You will need to use information from a number of websites for this assignment. This will include the name of the site, a categorization of the site, the state where the company is based and an exact description of the product. You will go on to quote the price listed for your product on that site, other extra fees the site might be charging and the shipping cost. As explained below, we will assume you will be paying a fee to insure your product in case it gets lost while being shipped to you. From these four values - the price, extra fees, shipping and insurance - you will be able to calculate the total cost you must pay the company to buy the product. Beyond this, there are also two other payments you have to consider when calculating your total bill - one to your state government in the form of sales taxes, and two - to me - for teaching you how to use the web for doing your shopping. Whenever possible, use the actual information you find on the websites - but this assignment is primarily about using spreadsheet software, so don't get bogged down searching the web forever for information that may not be available. If necessary, make up information you can not find.
Here is the deal with the Insurance - you will be purchasing it from a company named I.I. Insurance. (Obviously, this part of the assignment is complete fantasy.) This company insures anything for a flat "base" fee if it is worth under $100 dollars. It also has an "incremental" fee of a certain set percentage for any excess cost over $100. Here is an example, if the base fee was $5 and the incremental was 10% - and your product cost $180 - you'd pay $5 + 0.10 * (180-100) = 5 + 8 = $13.
You will do the cost pricing and bill calculations for a number of different sites to determine the best overall price you can get. You will be sorting the information in various ways and getting several printouts. You will also generate a pie chart showing the breakdown of the total cost at one site and a stacked column chart comparing the complete bill from all the sites. Finally, you will explore how a different tax rate, an itemized breakdown of my cut and the inclusion of yet another site all affect the picture.
While reading the assignment, refer to the example at the end of the webpage to help visualize what is being described. Your own spreadsheet can/should vary significantly from what I have shown. Your own design, wording and formatting will differ.
Your spreadsheet should have a title across the top - listing its purpose. Be sure to supply the usual identification - including your name, the date, your TA, section and "HW6" - in the spreadsheet. Also, towards the top put four default values: the state you live in, the sales tax rate in that state, the base fee for I.I. Insurance and its incremental fee. Make sure proper labels are used to mark the values. Format the actual tax rate, and the incremental rate to show as a percent. The base fee should be formatted as a money amount.
The spreadsheet you create should mainly consist of twelve columns. Some of these will be values you look up. Others will be calculated. Your first column will contain the names of the websites - use some short version of this, not the whole url. The second column will list the category that the site falls into - you can use the list I had in the first assignment - things like Shopping, Auction, Bot and Corporate. In the third column, place the state where that company is based - on many sites you can easily determine this information - but if not, make it up. In the fourth column, place a description of the product - it might be the exact same item over and over - or you might have only found similar products at some of the sites.
Then comes the pricing info. Column five, should list the price that the particular site is selling the product for. Column six, should be a value representing any other costs (besides shipping) the site might charge. Some might have no extra costs, some if you look carefully - might have some hidden fees. Column seven will be the shipping costs to send that product to your home.
Now for the calculations. You will have to type in a good equation once into each column and then copy it to the rest of the cells within that column. Do you remember an easy way to copy something down a column? Column eight will be the insurance charge for I.I. Insurance as explained already. Hint, this calculation will involve adding two values together - as the example above demonstrated. You will be copying this formula down the column - so you definitely want to use absolute cell reference here for the parts of the equation that are not changing when it is copied to new rows. [Note, this assignment assumes we are dealing with products of significant value - so that in most cases, you will be purchasing things well over $100. If you have picked a product where that it not true - then change the situation to assume I.I. Insurance starts charging an incremental fee for the value over $10 - instead of $100. I don't want to make the complexity of this equation worse by forcing you to use an IF function here.]
Column nine, will list the Total Cost of the product. You can think of that as the money you will be paying the company directly. As explained above, this is the sum of the last four values - price, other fees, shipping and insurance. What built-in function can you use to calculate this? (True, shipping and insurance is not really money going directly to the company - but for our purposes we will include these in the cost. We will assume the company is handling the transactions with FedEx, UPS and I. I. Insurance.)
The next calculation is in column ten - it is the tax to be paid. You calculate this based on Total Cost. We are going to assume a certain rule is in effect - that being that when the company is based within the state you live, you must pay the sales tax in that state. Otherwise, you pay nothing. (This isn't necessarily a real rule on the Internet, but we are using it for pedagogical reasons in this assignment.) Now this is an interesting calculation. The value is calculated in one of two different ways depending on what states are involved. What kind of built-in function do you use if there is different ways to calculate something. (Hint: Did you read the linked help webpage that is referenced many times within this assignment?) Where is the name of your state located within the spreadsheet? Where is the tax rate in your state located? Are they always only in those set cells? Well, then what kind of cell reference do you use to refer to them? What cell tells the name of the state where the website is based? Is this always the exact same cell or does it change from site to site (row to row)? So, what type of cell reference do you use for this part of the equation?
In column eleven, you will enter a value to indicate what Jt's Cut should be. For now, enter any one value into all the cells in this column. Later, we will redo this as a calculation. (No, you can't enter zero for my cut. I am here working on this assignment on a weekend - and I sure would enjoy some extra income.)
Finally, column twelve is the last major calculation - that is, your Total Bill - which is the Total Cost you pay the company with Taxes and Jt's Cut added on. (Just to be different, can you do this without using the built-in function you used in column nine? You only have to add three things, and thus, maybe the straightforard way - without the built-in function - is just as easy.)
Let us include a few helpful values in to our spreadsheet. In the row below all the data on the various sites you should include one extra row showing the average of all the values in each column from five through twelve - that is, where all the costs and calculations are. These averages can be calculated by using the obvious built-in function across the range of values listed for various sites. Lastly, on the next row after that, for the very last column, calculate the Best Buy - which would be the cheapest of all the Bills. (Now, which built-in function would be perfect to show you the smallest of a column of numbers?)
Here are some requirements for your spreadsheet. You will need to enter data for seven dealers. Each column should have an appropriate header - you can use more than one cell if necessary. A label saying "Average" should be placed in an appropriate place, as should the phrase "Best Buy". Adjust the widths of the columns to fit the information properly. You are expected to use alignment, fonts, sizes, styles and borders appropriately to make the spreadsheet look professionally made. (No need to copy mine.) Adjust the row heights in order to fit large characters. All dollar amounts should be formatted correctly.
Try to use sites from more than one category. You must have at least one site based in your state (and thus you will have to pay sales tax on that entry) and have at least one other that is based in a different state (and thus will not include sales tax.) Try to ensure that some of the Item Descriptions are exactly the same - so you are indeed making an exact comparison. But, all of them do not have to be completely similar. Hopefully, most of the actual prices will be different - or this spreadsheet will not be very interesting. Show some examples of sites that have something other than $0 as extra fees (even if you have to make up this info.) Some sites should have shipping costs but not all of them have to. Finally, as already stated Jt's Cut should be more than zero - but the same value for all sites.
After you complete the spreadsheet to your satisfaction you can begin getting the printouts and doing the final tasks as itemized here:
Checklist:
EXAMPLE: (If printed, this will be split over a number of pages and be hard to follow, but you can and should come back to the actual webpage to view the example more carefully.)